
 Last modified:
Sunday, 23-Aug-2020 02:02:36 UTC. Authored by: Fiona Carter (frabbitry at gmail.com) Edited and maintained by: Elisa E. Beshero-Bondar
(eeb4 at psu.edu). Powered by firebellies. Last modified:
Sunday, 23-Aug-2020 02:02:36 UTC. Authored by: Fiona Carter (frabbitry at gmail.com) Edited and maintained by: Elisa E. Beshero-Bondar
(eeb4 at psu.edu). Powered by firebellies.
Last modified:
Sunday, 23-Aug-2020 02:02:36 UTC. Authored by: Fiona Carter (frabbitry at gmail.com) Edited and maintained by: Elisa E. Beshero-Bondar
(eeb4 at psu.edu). Powered by firebellies. Last modified:
Sunday, 23-Aug-2020 02:02:36 UTC. Authored by: Fiona Carter (frabbitry at gmail.com) Edited and maintained by: Elisa E. Beshero-Bondar
(eeb4 at psu.edu). Powered by firebellies.For this assignment, you’ll use a couple of different export options to create maps that you can publish on a website.
For this assignment, you should use one of the maps you made previously or make a new map using guidelines and techniques covered earlier. We advise working with a simpler map, perhaps just a base map and a set of points. You might want to pull some data from your working project code, and if you have a set of place names without geocoordinates, you could try looking up latitude and longitude coordinates or visiting a geomapping API service.
This is for people who have place names but need to find out latitude and longitude coordinates. Some of you completed a “TimeMapper” assignment with Dr. B in other classes using a simpler mapping program running with Google Sheets. In that program, you can keep an column of place names, and then add a column that does an “API lookup” of the first available geocoordinates associated with a location. Here is the formula we used in Google Sheets to do that lookup, which returns latitude and longitude coordinates:
=JOIN(",", ImportXML(CONCATENATE("http://nominatim.openstreetmap.org/search/?format=xml&q=",A2), "//place[1]/@lat | //place[1]/@lon"))
(Be sure to scroll to the right to read the complete formula.) If you have a column
of place names output in Column A, and paste this formula to fill in Column B (like
we've done in QGIS 2), it will read the place name in the corresponding cell in Column
A and look up and return the first set of geocoordinates it finds. Note the XPath
in the formula, as Open Street Maps' data is stored in XML. If you wanted to return
all the available sets of geocordinates, or data associated with them, you could remove
the [1] predicates after //place and look at the content of the //place element.
To split this data so that you have latitude in one column, and longitude in the other,
you can just split up that XPath so that one column (B) reports ONLY the @lat and the next column (C) reports ONLY the @lon associated with your place name in Column A.
It will be possible to pull this geodata in XQuery, too, by the way, working with
Open Street Maps as an external database. Happy experimenting! You will be able to
import a TSV or CSV into Google Sheets and export it from there as a TSV or CSV as
well. There may be a working variation on this JOIN() function in Excel or other spreadsheet software, and this may require a little investigating.
Please report on your experiences with pulling geodata and raise questions on the
DHClass-Hub and find us on Slack if you want some help! You will want to inspect your results
to do a “sanity check” and make sure they are the correct locations, and make any
corrections you need to make for your map.
From working on previous assignments, you’re probably already familiar with the process for exporting to PNG. From the Print Layout window, you can use the “Export to Image” icon, pictured below, in the top menu bar, and then select PNG as the file type.
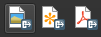
The “Export to Image” icon is the first of the three icons pictured above.
Scalable vector graphic, or SVG files, are composed of vectors, something you’ve learned about previously. Because of that, they’re able to be scaled without compromising the image appearance, clarity, or integrity. You can zoom in on these pictures without them becoming pixelated.
To export to SVG, in the Print Layout menu, click on the second of the three icons pictured above.
You might be presented with several error messages warning you about exporting to SVG. This is particularly true if you’re trying to work with a more complicated map, like the one you created for the second assignment. However, you should just click through them.
You should eventually be presented with the “SVG Export Options” window, pictured below.
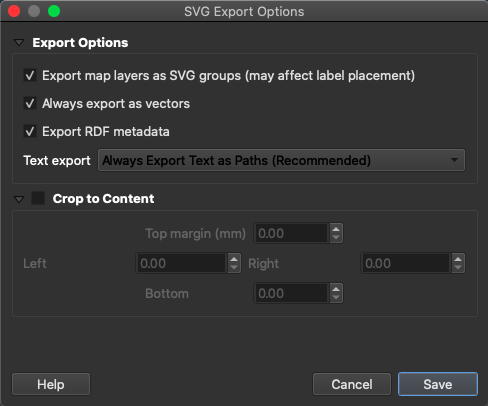
You should make sure that the boxes next to “Export map layers as SVG groups,” “Always export as vectors,” and “Export RDF metadata” are selected. You’ll learn more about why using groups are important in the upcoming SVG unit.
You should then have a file that you can open in a web browser. You could also open up the SVG file in Oxygen; if you did, you might notice that it’s written in XML.
Note: There are issues with exporting to SVG if you used a color ramp or a raster layer. Furthermore, transparency settings do not translate well to SVG.
Leaflet is a JavaScript library for interactive maps. There is a QGIS plugin called qgis2web that will generate the code for a Leaflet web map for you.
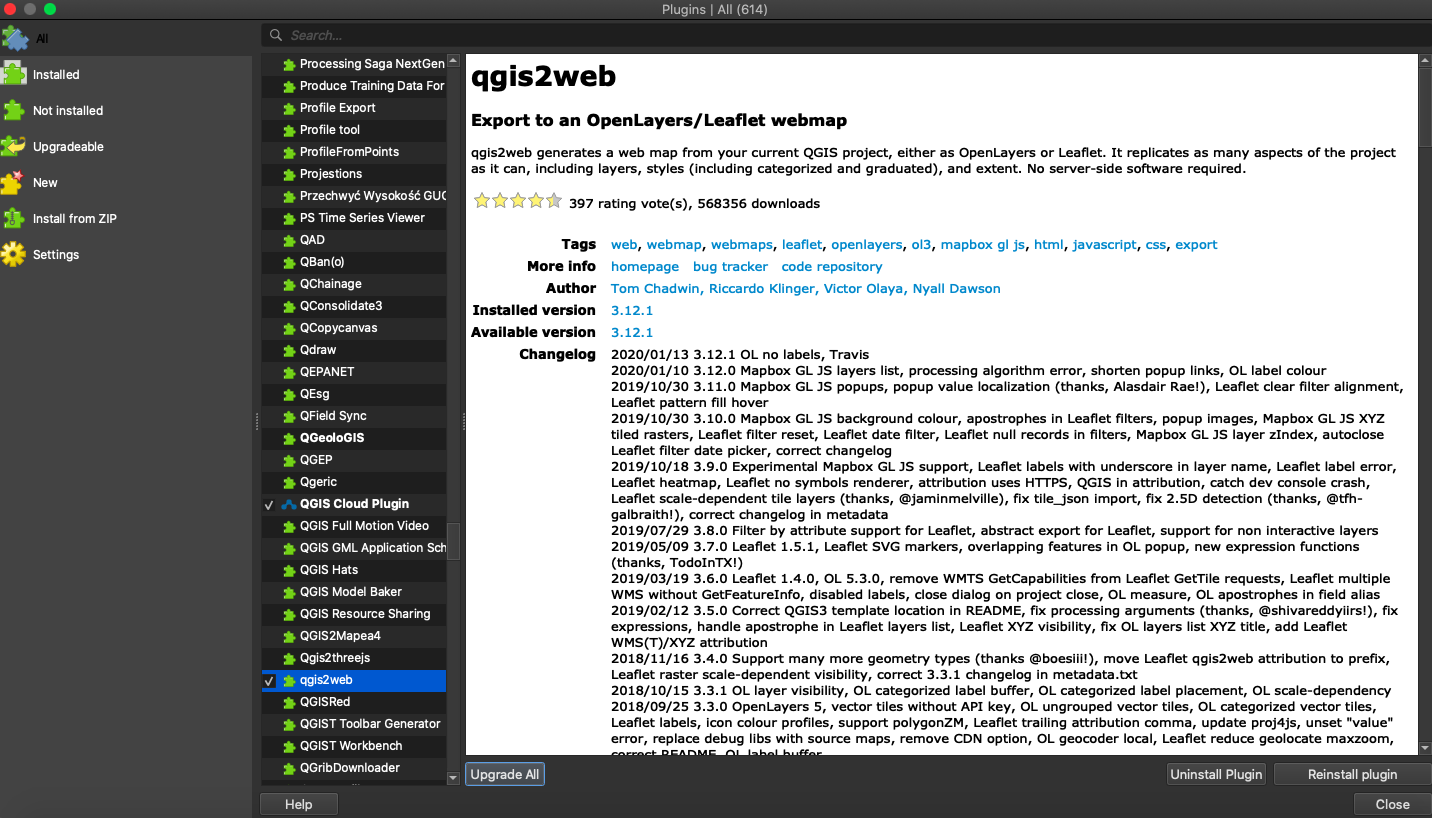
To install qgis2web, go to the main QGIS window, and then go to, in the top ribbon, Plugins>Manage and Install Plugins…
In the “All” plugins tab, search for “qgis2web.” Then, click on “Install plugin” on the bottom right-hand side of the page. I already have qgis2web installed, so my options, pictured below, are to uninstall the plugin or to reinstall it.
Once you’ve installed qgis2web, close the Plugin window. Go to the “Web” section of the top ribbon and hover over “qgis2web” from the dropdown menu, then select “Create web map.”
You should now see the “Export to web map” window. Make sure that the layers you wish to be included in your web map are checked in the list of “Layers and Groups.” Furthermore, at the bottom of the window, make sure that “Leaflet” is selected as the type of web map to be generated. To see a preview of your map, click on “Update preview.” In the “Export” tab, you can select the location to which you want your web map to be exported.
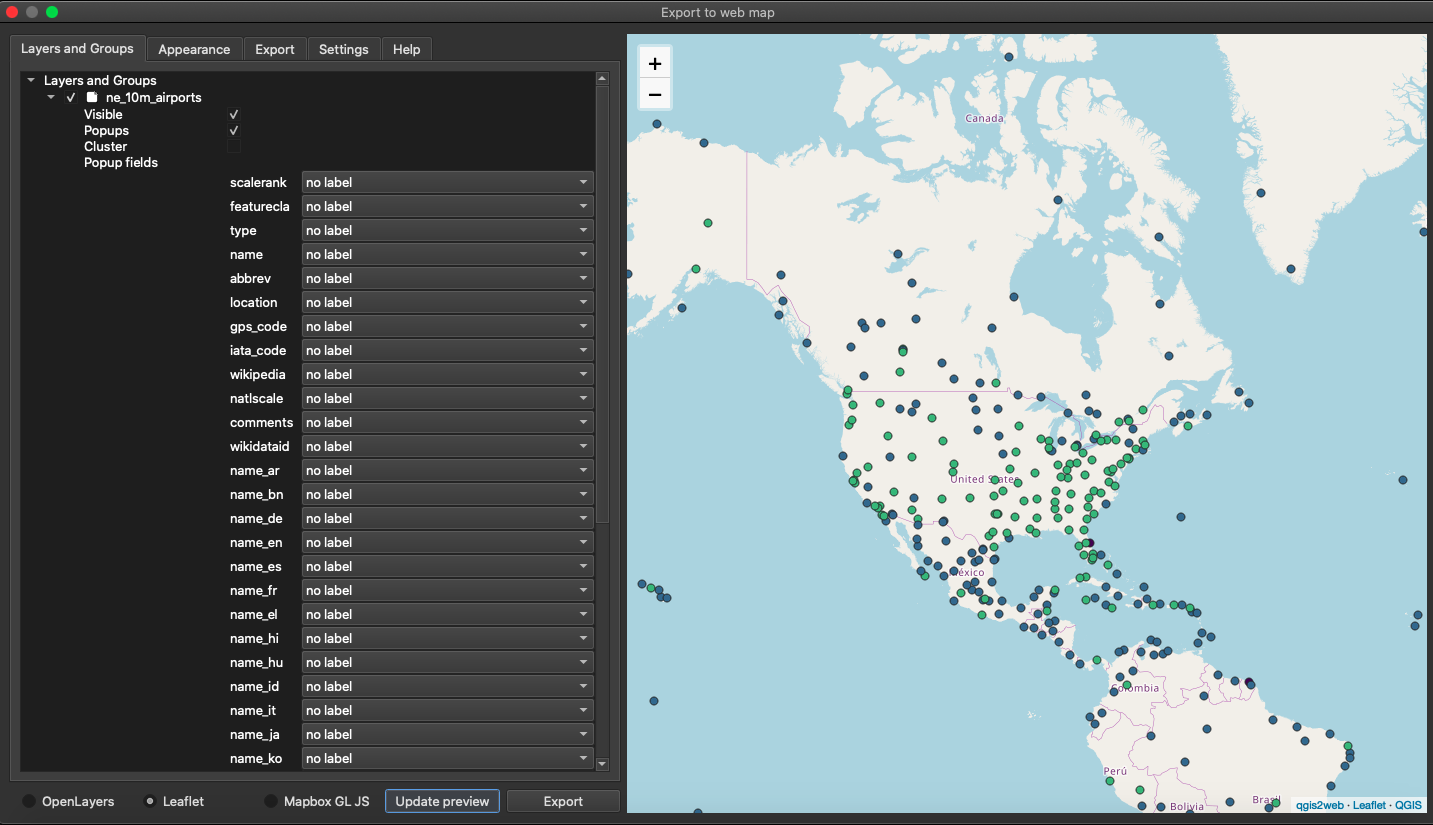
When you are finished, click on “Export” to create the web map.
A progress screen should pop up, indicating the progress of the map. When it is finished, you can close the window and navigate to the folder that you put the web map into.
There will be a folder, the name of which will start with “qgis2web.” Inside the folder, there will be different web page files and folders: a folder for javascript, a folder for css, and so on. There will also be an index.html file that you can open on a web browser to view your map.
When you are finished making the exports, submit two files to Canvas:
Then, upload your web map folder to your personal website. Let us know in a comment on your submission on Canvas what the name of the folder is so that we can navigate to the index.html file.
Here is the complete series of QGIS exercises on newtFire:
For more on QGIS, feel free to consult the QGIS Tutorials and Tips website, which will teach you how to do pretty much anything with this software.