 Last modified:
Monday, 27-Nov-2017 04:45:53 UTC. Maintained by: Elisa E. Beshero-Bondar
(eeb4 at psu.edu). Powered by firebellies. Last modified:
Monday, 27-Nov-2017 04:45:53 UTC. Maintained by: Elisa E. Beshero-Bondar
(eeb4 at psu.edu). Powered by firebellies.
Last modified:
Monday, 27-Nov-2017 04:45:53 UTC. Maintained by: Elisa E. Beshero-Bondar
(eeb4 at psu.edu). Powered by firebellies. Last modified:
Monday, 27-Nov-2017 04:45:53 UTC. Maintained by: Elisa E. Beshero-Bondar
(eeb4 at psu.edu). Powered by firebellies.We have been working with a table of nineteenth-century labor survey results from the Nell Nelson project in our XSLT and SVG units, and we return to it now to integrate HTML with SVG, JavaScript, and CSS. This assignment will give you experience with designing a project HTML page to host SVG together with HTML, and to integrate information from an SVG chart with information retrieved on-click from an HTML table. In the process, you’ll return to the “drawing board” to output your HTML and SVG afresh, with a plan for setting attributes and elements for users to interact with in JavaScript. You will be reviewing much of what you have learned in this course and gaining experience we hope you will also apply to your project design work.
We began here, with a TEI XML file we created by transcribing this table, using feature structures markup in the TEI:
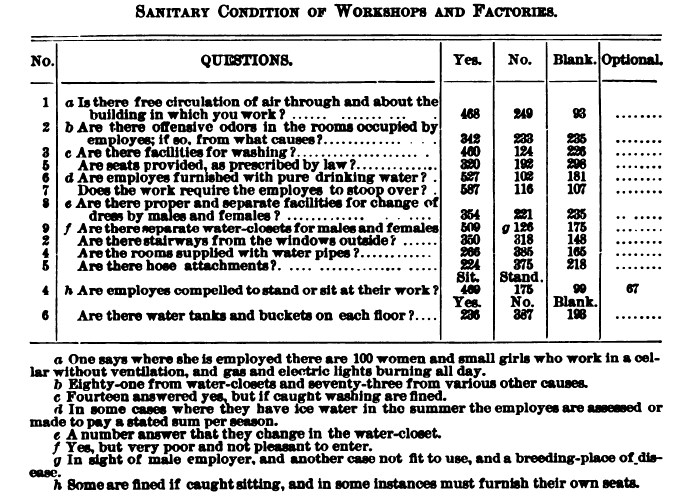
Our goal has been to produce a readable web interface to make this table data more accessible to interested readers. We are now ready to work in stages from our TEI XML to produce something like this webpage, to set SVG elements in relation to HTML elements on a webpage, and to take this one step further to add JavaScript and make the presentation dynamic. Our SVG on this page is pulled from a student homework assignment from the Fall 2015 class, and we have worked on fitting the SVG with HTML elements. In our fully functioning model (which we will show you in class and post on the NewtFire website after you have completed this assignment) we wrote JavaScript to script a series of events to occur with a site visitor clicks on a bar of the SVG graph: On click of a bar, the table to the right will change to reveal a currently hidden table row that contains the survey result data for the particular survey question represented by that bar. You should not produce exactly the same design we did (which in some respects is a little visually repetitive since we reproduce the survey questions twice), and we expect that you will each come up with your own way to lay out the information on your solution page. For this assignment, then, we ask that you accomplish the following:
@xml:id attributes to the <fs> elements to simplify the identification of the survey question and answers.@xml:id attributes, but more importantly so that you can find a way to associate the HTML table information you output with the JavaScript on the page. We did this by making each bar on the stacked SVG bar graph respond on click by revealing its associated table row of survey response data, which we had started by mostly hiding from view (only permitting the first question’s results to be shown) with a couple of rules you can see in our CSS file. You might choose to do something different , perhaps to show or hide the bars on the SVG plot, and associate them with table information. You might even decide to play a little (once you have achieved basically functional JavaScript) to try something unusual. (For example, can you trigger an audio event such as a series of musical tones to play, one tone for each bar, treating each stacked bar like the keys of a sort of toy piano? For some guidance on this, have a look at this collection of posts on Stack Overflow: http://stackoverflow.com/questions/9419263/playing-audio-with-javascript.) You don’t have to make your graph play music, but you could experiment with finding a way to make the bars change colors on click, or outline them (as we did in our solution) with a bright color when selected. However you decide to do this is up to you. xsl:stylesheet input information than HTML does, we typically do not try to integrate the two outputs in one XSLT stylesheet. We recommend, then, that you output the SVG separately, but design your XSLT for HTML to hold a designated <div> element (like <div id="svg">) to set the SVG apart and find a way to balance it in your HTML page layout with another div (or set of div elements) that you can manipulate with CSS styling together with SVG @width, @height, and @viewBox attributes to position on the page together in a user-friendly way. You will need to design your output SVG (using any strategy that works for you) to share space on an HTML page with table data. We recommend that you read and apply Amelia Bellamy-Royds’ tutorial on scaling SVG with viewBox, preserveAspectRatio and meet: https://css-tricks.com/scale-svg/. <g> are outlined with a red border (controlled with an SVG stroke property, which we wrote as a toggle in our JavaScript). We recommend you begin this assignment with a sheet of paper and a pencil, or something that helps you sketch out a battle plan
. This is how we work on project design challenges: We start with a document analysis of our input XML and try to sketch something on paper about how we want to output and visualize information from that XML in a user-friendly website. With this assignment we wanted to model that process with specific task that might be like something you are working on for your projects. Here’s some guidance on what you will need to plan for and some strategies we used to develop our solution:
@xml:id attributes. Review your HTML and SVG output, and think about what you will need to do to your original XSLT to output HTML and SVG in a new way that will allow you to relate the SVG to the HTML. Your output HTML table row data is analagous to your output of stacked bars, so we recommend you find a way to create a system of @id attributes that will help you to correlate the two kinds of elements. But there will be a problem with this that you must anticipate: When you put SVG on the same page with your HTML, you cannot have the same @id attributes on the SVG <g> elements that you use on the HTML <tr> elements! How will you deal with this? In order to make the two sets of elements relate to each other, you need to have each one contain (as in a string) the relevant contents of the other, and we recommend you use our @xml:id attributes that we added to the input TEI XML for this purpose. One of your sets of @id attributes can contain an extra string of information separated from the rest with something like a punctuation mark (hyphen, underscoree, etc, whatever makes sense). You want to plan on having to tokenize one set of @id attributes to find out where the relevant portion of them matches to the other set. In our solution, we used Attribute Value Templates to grab the @xml:ids from the XML for both sets of SVG and HTML @ids, and we set up the SVG to hold a little extra information in front, positioning our curly braces like so: "svg-{AVT here}".<div> element with a special @id (like <div id="svg"> that will house your separately output SVG. You should also plan out other <div> container elements (or devise some other good strategy) to hold the HTML table or tables. In our solution, we output three separate HTML tables just as we did in XSLT Exercise 3, but if you do not want to include the other tables that aren’t represented in the SVG graph, you don’t have to. Alternatively, you could decide to output two additional SVG graphs to hold the information from the other two questions that we didn’t plot in our SVG Exercise 3. That is up to you. If you would like to include the image of the original 19th-century table in your output, you may download it from here.<div>, and there are a number of strategies available to work with this, involving attributes you will want to write into your SVG and rules for width and height in CSS. Feel free to use our model solution here as a guide to developing your own layout. We consulted Amelia Bellamy-Royds’ brief and very informative tutorial on scaling SVG with viewBox, preserveAspectRatio and meet: https://css-tricks.com/scale-svg/ to develop our solution, and we recommend strongly that you spend time with this tutorial not only for this assignment but for your project development.init(). That init() (or initial()) function should add event listeners on the elements you expect your site visitors to interact with. This is familiar territory, but we found ourselves writing the element selection a little differently than we have done in the past: In our SVG, we set @id attributes on each <g> element, and there was at least one outer <g> containing an entire graph. We only wanted something to happen on click of each stacked bar, so we wanted the inner <g> elements to be made clickable. To do that we used a handy selector in JavaScript that uses CSS syntax to identify elements that hold a specific attribute called
querySelectorAll(): We wrote it like this to define an array of elements:
var svgSelect = document.querySelectorAll('g[id]');
That code creates an array of all the <g> elements that hold an @id attribute. After this we set up a for-loop with the range variable i to step through each member of the array of svgSelect.length, and then we set up our addEventListener() to run on the svgSelect[i] (or the svgSelect variable at position i), and to fire the next function() in sequence in the event of 'click', just as you have already done on previous assignments. Note: If you use the @id in other ways on your outer wrapper <g> elements, you will need to do something more, perhaps to set a @class attribute on just the <g> elements you want to grab here. (Modifying your code to suit your specific plan is part of this assignment!)function init(), and remember that each function needs to call the others in turn for your JavaScript to work. We devised a couple of simultaneous toggling effects, and though we did not use the @classList toggle, we might have done so and perhaps written this differently. But our solution involves one function that fires on click to highlight a stacked bar in the SVG and at the same time expose a previously concealed HTML table row (concealed with the CSS display:none. To initiate the sequence and make a table of one set of survey results visible at the moment when the page loads, note that we must first of all define an exception for one row to be visible from the start, in both our CSS and our JavaScript. First, we had to define a global variable for a table row that sits above all the functions so that we can call it and redefine it in each one of our functions in turn. We do not really define it at first, we just name it at the top of our JavaScript file, and then inside function init() (that fires when the window loads) we set a variable connected with our default table row. Our CSS also contains two rules: one to conceal all the table rows, and one after it that exposes just the one, single row that we want to show when the page first loads. We know this is a little confusing, but it is going to be necessary to have something visible to start with and then on click, to set the function that replaces the @id of that initial row by redefining that variable for the table row in your next JavaScript function, the one that fires on click of a new bar. Here is how we did it.
table#graphData tr[id] {display: none; height:100px; width:300px;}
table#graphData tr[id="QA1"] {display: table-row;}
Here we define two rules for the <tr> (table row) elements with @id attributes that are inside table element with the @id of graphData (the table we output to correlate with our SVG bar graph. (Note how the CSS selectors work to step down the tree from a parent table element to the child tr elements.) We set the general rule to conceal all of the rows, and then we write a new rule that exposes just one row for the specific @id="QA1", so that it will be showing when we first load the page. This might look like a contradiction in terms, but it works because CSS permits a more specific rule to override a more general one.global variable for the table row, and then in our function init() we give it a definition connected with the only visible table row defined in our CSS:
      var trow; //Here we name the global variable for the current one-question row in table,
              which we will call and redefine in each of our JavaScript functions.
              This makes the variable available to invoke in all of the functions.

       function init() {
//other stuff for adding event listeners to the SVG bars goes here

   trow = document.getElementById('QA1'); //Here we have called the global variable
              and we have given the specific definition for it that applies in function init()
  }
By doing this, we create a variable set to the only value that will be showing at the load of the HTML page, and that variable can then be passed to our next function, which fires on click of a stacked bar. What should happen, if you click on, say, the second stacked bar of the SVG plot, is that the currently-showing table information from the first stacked bar will disappear and be replaced by the table row information from that second SVG bar stack. To make this happen, we first need to call a function that will cause the previously displaying table (and any associated highlights) to disappear. We called that our hide-last() function, and it is supposed to fire first of all when a visitor clicks, so we call it like this:
        function tableShow() {
                 hide_last();

                  /*The rest of your function variables and events will go here */
               }

    function hide_last() {
            /*define the concealing events here */
        }
<g id="SomethingSpecific"> with an associated <tr id="SomethingElseSpecific">, however you have defined that relationship. We have to set this up so that each set of @id attributes will contain the same string of text pulled from the @xml:id attributes from our TEI XML. To do this, you will either need to match on a split portion of the @id, or add something missing to that @id to complete the match. Our solution (which does not have to be yours) involves taking an SVG attribute in this form: id="svg-ID and splitting it after the hyphen to match the second part of it with an HTML id="ID". We did that with a nifty JavaScript operation called split(), like this:
               trow = document.getElementById(this.id.split("-")[1]);
               trow.style.display = "table-row";
Let's look at this from the inside out: Here, the word this in JavaScript always refers to the currently selected thing, whatever it is with the event listener that the visitor has clicked on. In this case that's a single SVG stack of bars. Our variable trow is redefined from what it meant in our function init() so that it now holds an array of, not the full @id attrribute, but rather the piece of it that sits after the hyphen ("-") inside the @id. You can read about and experiment with the JavaScript split() function here on tizag.com: http://www.tizag.com/javascriptT/javascript-string-split.php. Basically split() involves creating a little array of two (or more) pieces depending on the character you designate as the point of a split or division: so in our case we have a piece before a hyphen and a piece after it. Remember that JavaScript counts from zero, so we can identify which piece to match on based on its position in the JavaScript array, either 0 or 1. Since we want the piece after the hyphen, we grab the piece (or token) at position [1]. What we say here in re-defining our variable trow is: Go into the document and get the single, particular element that holds the @id equal to the second half of the split of this @id (from our SVG bar stack). And that element with that @id will be our HTML table row.
stroke attribute (or border) of all the child elements of an SVG <g> element, by adding it to "this" in the function that fires after a click: this.style.stroke = 'red';. The real challenge here is to figure out how to remove that highlighting, which we did in our hide-last() function. We cannot refer to "this" in hide-last() because it is supposed to refer to anything that was selected before, so we needed just to look for any and all g elements with @id attributes that might have highlighting around them, and for that we used querySelectorAll() to find those by their CSS selectors, as we did earlier when we defined our elements to add event listeners in our function init().
You will need to submit multiple files to complete this assignment:
We ask that you associate your files with relative URLs so that you can upload them to Courseweb or put them in place (in relation to each other) on whatever web server you wish to use. Submit this on Courseweb, but if you like, you may also mount your files on your newtFire or GitHub io webspace.