
 Last modified:
Wednesday, 28-Apr-2021 17:11:55 UTC. Maintained by: Elisa E. Beshero-Bondar
(eeb4 at psu.edu). Powered by firebellies. Last modified:
Wednesday, 28-Apr-2021 17:11:55 UTC. Maintained by: Elisa E. Beshero-Bondar
(eeb4 at psu.edu). Powered by firebellies.
Last modified:
Wednesday, 28-Apr-2021 17:11:55 UTC. Maintained by: Elisa E. Beshero-Bondar
(eeb4 at psu.edu). Powered by firebellies. Last modified:
Wednesday, 28-Apr-2021 17:11:55 UTC. Maintained by: Elisa E. Beshero-Bondar
(eeb4 at psu.edu). Powered by firebellies.In this tutorial, we guide you through a process of exporting a Cytoscape network for interactive display on a website, like these from our Spring 2021 Large-Scale Text Analysis class:
This tutorial works with example cytoscape files and network visualization exports from each of these projects, and this version of the tutorial is working with screen captures from Cytoscape 3.8.2 on Mac OS Big Sur. We begin with a view of a network ready for export from the Blues project, and we will continue with files exported for the Disney Songs project, with thanks to our student developers Mia Borgia and Jacqueline Chan for investigating the several export options.
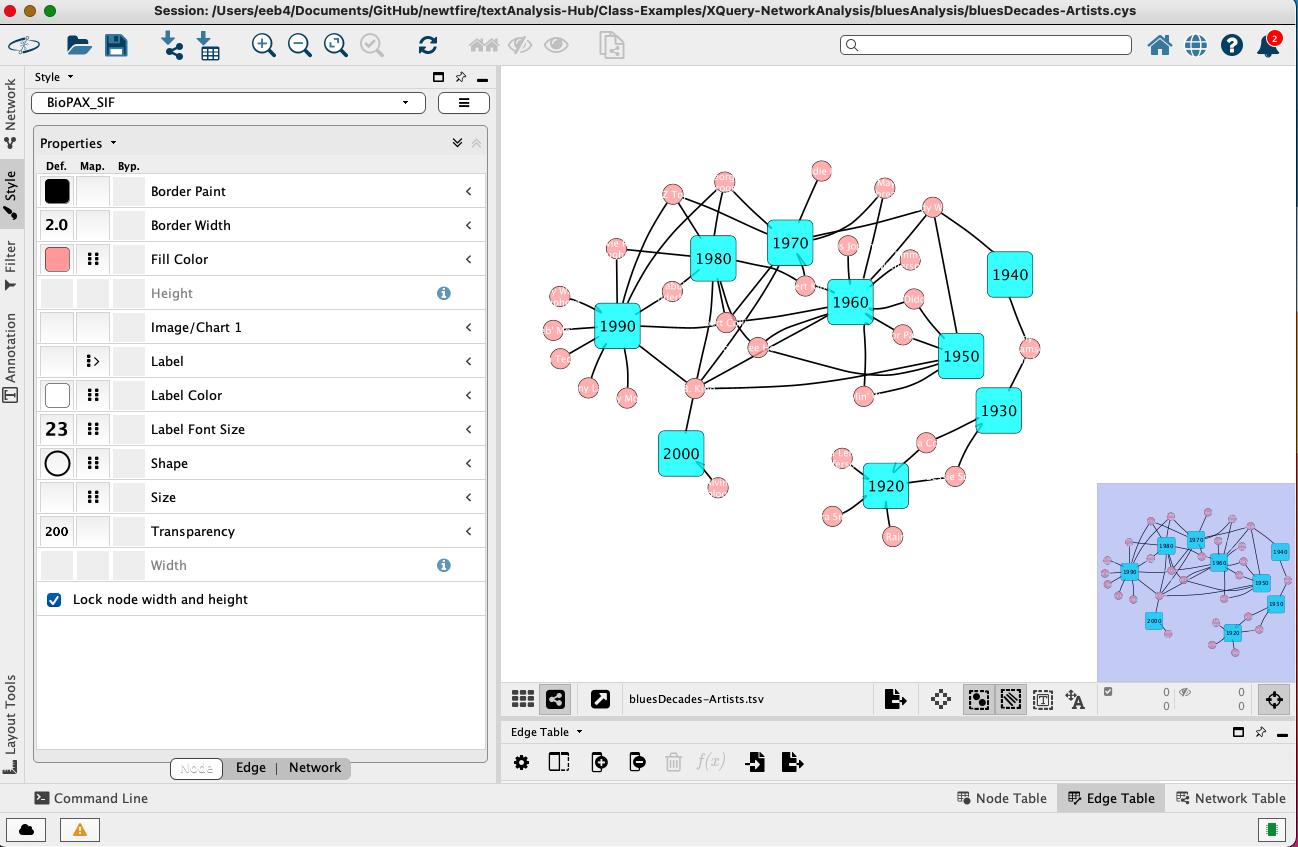
In the figure above, note that the lavender-colored box on the bottom-right of the workspace is showing the viewable area for purposes of export. To export this graph, go to the File menu at the top of the screen and choose Export, noting the available options:
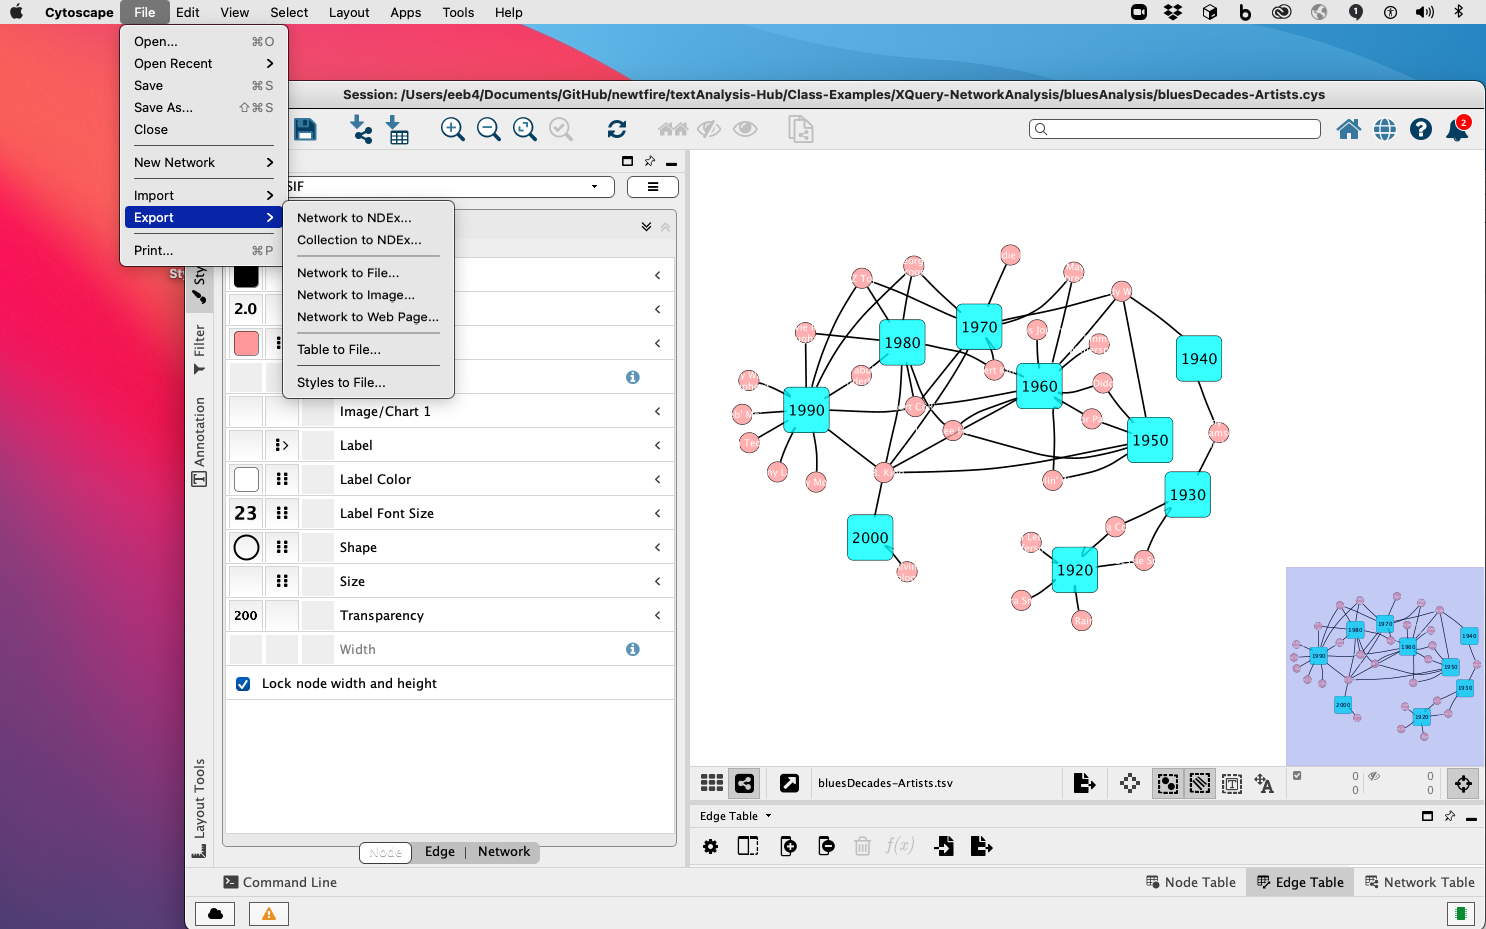
On this menu, you are already familiar with the Network to Image option (as discussed in Network Analysis Exercise 2). This time, we will select Export to Web Page. When we do, we see a screen set by default to Export as: Full Web application
. We recommend choosing an alternative to this, by selecting the arrow toggle to its right and selecting Simple viewer for current network only
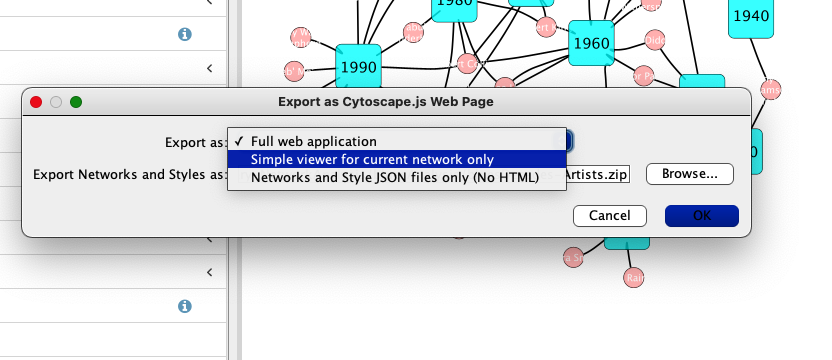
Of these, we will select the Simple viewer (not the default) because the Simple Viewer is the simplest to integrate into a web project in a way that preserves the styling prepared for our network in Cytsocape.
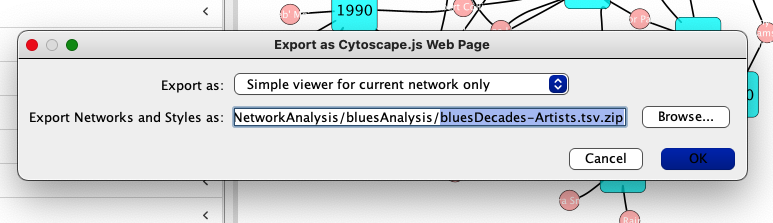
Note that exporting this will prepare a zipped directory for download in the folder you designate: edit this with care. We recommend saving to a filepath location associated with your website development (such as the docs directory that publishes a GitHub Pages website from your GitHub repo).
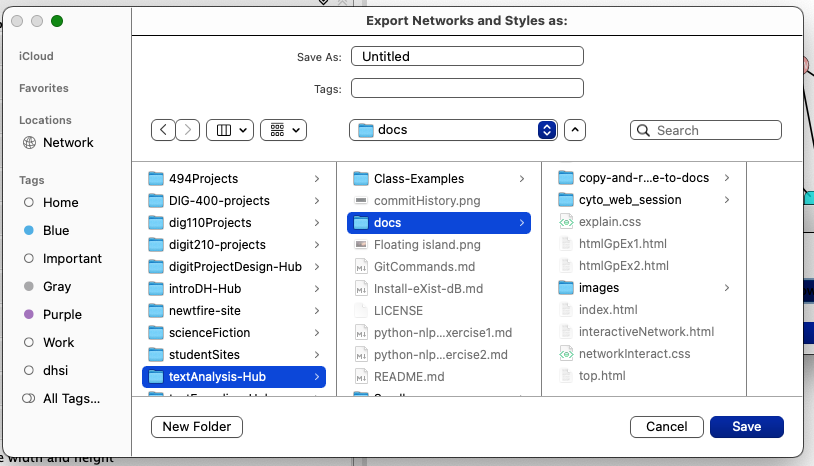
We now exit Cytoscape (saving our session) and go to work on the website. Unzip the zipped directory and find a directory named web_session
available in your website file directory. For convenience to distinguish this as related to our Cytoscape network, we renamed this as cyto_web_session
. Inside it looks like this:
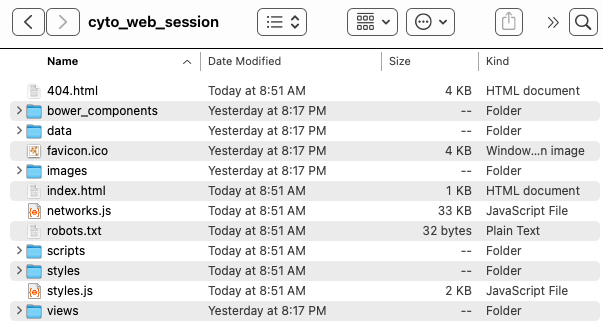
The directory for Cytoscape's Simple Viewer contains (among other things) a networks.js file and an index.html. If you open the networks.js file in <oXygen/> or a code editor, you will see a view of your network data (you will recognize your node and edge data) in Javascript Object Notation (JSON) format. If you open the index.html locally in a web browser (open a web browser, and use CTRL + o (Windows) or Command + o (Mac), you can preview an interactive view of your network. You could always link to the index.html as a separate page from your site, but we recommend embedding the network directly on a page To embed this on a website, we recommend pointing to the JavaScript files in your web page. This is what we will demonstrate next.
To embed the interactive network on your website, you need to work with the JavaScript files, and point to them from your website. Here is an example of how to do this based on a website file directory structure in which an interactiveNetwork.html project webpage is sitting above
a cyto_web_session directory containing the Simple Viewer files exported from Cytoscape. The interactiveNetwork.html page will need to accommodate <script> elements to point to the JavaScript in both the <head> and <body>. We should set a container element like a <div> or <section> element around the area in which we want the interactive graph to appear and give that container element a special @id attribute for referencing with CSS. Finally, we need to add some CSS to style the viewing area (adding this to the project CSS file, or linking a special CSS to this page as needed).
The following code block indicates basically needed in the HTML file, and which JavaScript files need to be referenced to embed the Simple Viewer on the page:
        <!DOCTYPE html>
<html xmlns="http://www.w3.org/1999/xhtml">
    <head>
        <title>Interactive Network Graphs</title>
        <link rel="stylesheet" href="networkInteract.css"/>
        <script src="cyto_web_session/networks.js"></script>
    </head>
    <body>
       <div id="cy">

                <script src="cyto_web_session/networks.js"> </script>
                <script src="cyto_web_session/styles.js"> </script>
                <script src="cyto_web_session/scripts/vendor.js"></script>
                <script src="cyto_web_session/scripts/main.js"></script>
        </div>

    </body>
</html>
Note that we created a container element, <div id="cy"> to hold the interactive graph. All file associations are relative and that the last two JavaScript script associations point into scripts subdirectory. These modifications will not be enough to view the embedded network, though. We also now need to add a block of code our CSS stylesheet to render it visible> We added the following to our CSS file:
#cy {
     width: 65vw;
     height:100vh;
     position:absolute;
     margin:auto;
     border-style:double;
 }
Upon making these modifications, provided there are not problems with competing CSS styling on your page, we expect you will be able to view and interact with your network on your project website. Preview it locally in your web browsers to be sure it works, and then publish your code. Congratulations on providing your site visitors with an interactive experience of your network data!