 Last modified:
Monday, 04-Apr-2022 04:47:50 UTC. Maintained by: Elisa E. Beshero-Bondar
(eeb4 at psu.edu). Powered by firebellies. Last modified:
Monday, 04-Apr-2022 04:47:50 UTC. Maintained by: Elisa E. Beshero-Bondar
(eeb4 at psu.edu). Powered by firebellies.
Last modified:
Monday, 04-Apr-2022 04:47:50 UTC. Maintained by: Elisa E. Beshero-Bondar
(eeb4 at psu.edu). Powered by firebellies. Last modified:
Monday, 04-Apr-2022 04:47:50 UTC. Maintained by: Elisa E. Beshero-Bondar
(eeb4 at psu.edu). Powered by firebellies.
With this pair of assignments you will first learn (in Part 1) how to extract data from your XML in a special tabular plain text format called a TSV file, which you will then import into the network analysis software, Cytoscape. In Part 2, you will learn how to analyze and organize your data as a network graph working in Cytoscape. What you are learning here will prepare you for other kinds of data analysis and visualization work, because the simple, handy TSV data format can be read by spreadsheets and web mapping applications, too. TSV stands for Tab Separated Values, and it applies a tab control character with the unicode special entity notation 	, which signals a movement to the next tab stop, the location the cursor jumps to when you hit the tab key. Basically a TSV presents a table layout in plain text, and actually, any plain text file can represent a tabular column format just by using a regularly repeating pattern of characters, such a white space or a comma (the comma-separated output is known as a CSV file). You should save these files with a .tsv (or a .csv) extension depending on whether you use a tab or a comma separator. Here is some sample TSV output from the Disney Songs project in TSV format:
Mena Massoud	voiceActor	Aladdin (Live-Action)	Alan Menken	composer
Mena Massoud	voiceActor	Aladdin (Live-Action)	Howard Ashman	composer
Mena Massoud	voiceActor	Aladdin (Live-Action)	Benj Pasek	composer
Mena Massoud	voiceActor	Aladdin (Live-Action)	Justin Paul	composer
Gilbert Gottfried	voiceActor	Aladdin: The Return of Jafar	Patty Silversher	composer
Gilbert Gottfried	voiceActor	Aladdin: The Return of Jafar	Michael Silversher	composer
Gilbert Gottfried	voiceActor	Aladdin: The Return of Jafar	Alan Menken	composer
Gilbert Gottfried	voiceActor	Aladdin: The Return of Jafar	Howard Ashman	composer
Gilbert Gottfried	voiceActor	Aladdin: The Return of Jafar	Randy Petersen	composer
Gilbert Gottfried	voiceActor	Aladdin: The Return of Jafar	Kevin Quinn	composer
Gilbert Gottfried	voiceActor	Aladdin: The Return of Jafar	Dale Gonyea	composer
Liz Callaway	voiceActor	Aladdin: The Return of Jafar	Patty Silversher	composer
Liz Callaway	voiceActor	Aladdin: The Return of Jafar	Michael Silversher	composer
Liz Callaway	voiceActor	Aladdin: The Return of Jafar	Alan Menken	composer
Liz Callaway	voiceActor	Aladdin: The Return of Jafar	Howard Ashman	composer
Liz Callaway	voiceActor	Aladdin: The Return of Jafar	Randy Petersen	composer
Liz Callaway	voiceActor	Aladdin: The Return of Jafar	Kevin Quinn	composer
Liz Callaway	voiceActor	Aladdin: The Return of Jafar	Dale Gonyea	composer
This is a portion of a much larger TSV file that represents metadata about music composed for the Disney movie Aladdin. The network data shows how composers of each song in the movie are connected to vocalists who performed that song. Our TSV expressed this relationship like a sentence: Source Node (voice actor) is connected (by the song) to the Target Node (composer). In this data, the songs as a connector of these two sets of people, forming the connecting lines (called edges) of a social network visualization (working with a larger sampling of song metadata from the project):

Network visualizations show us nodes and edges that connect the nodes. This is a bi-modal network: which means it show how two different groups are connected together (composers shown as squares and voice actors shown in ovals). We enlarged the nodes representing people in the visualization based on how many connections they have to others, and chose a layout to help visualize the nodes and edges as clearly as possible. This is not always easy when you have a lot of network data, but was not difficult with this small data sampling.
Other kinds of networks can be simpler, based on one kind of node only: Which people turn up together in the same locations? Or which ideas or sound patterns turn up together in the same paragraphs? These are all examples of co-occurrence networks: about things that share something. When someone gives or directs or influences another and we have data on that, we can plot a directed network where the connecting lines point from one to another. Networks can also be undirected when they simply plot connections or associations without a cause and effect.
Here is an example of much simpler co-occurrence network data, drawn from the Avatar project. This represents characters that appear in episodes of the TV series Avatar.
episode	Bato of the Water Tribe	character	Aang
episode	Bato of the Water Tribe	character	Sokka
episode	Bato of the Water Tribe	character	Katara
episode	Bato of the Water Tribe	character	Iroh
episode	Bato of the Water Tribe	character	Firebenders
episode	Bato of the Water Tribe	character	June
episode	Bato of the Water Tribe	character	Zuko
episode	Bato of the Water Tribe	character	Hakoda
episode	Bato of the Water Tribe	character	Bato
episode	Bato of the Water Tribe	character	Mother Superior
episode	Bato of the Water Tribe	character	Messenger
episode	Bato of the Water Tribe	character	Herbalist
episode	Bato of the Water Tribe	character	Aunt Wu
episode	Bending Battle	character	Aang, Katara, and Toph
episode	Bending Battle	character	Aang
episode	Bending Battle	character	Sokka
episode	Bending Battle	character	Toph
episode	Bending Battle	character	Katara
episode	Bending Battle	character	Katara and Aang
episode	Bending Battle	character	Zuko
episode	Bending Battle	character	Iroh
Notice how this data simply expresses the title of the episode followed by the character name. We include labels, episode
and character
, because they will help us to distinguish the titles from the characters visually in our network software. But this data does not specify what the connector is: We intend to plot the episode titles connected to the characters. That means we're seeing a source node and a target node with an implied connection. Network analysis can proceed simply on this basis. It is often up to us how we wish to express network analyses. In network visualizations, usually only the nodes have visible/legible labels (if they are visible at all), and the edge lines tend to be more difficult to distinguish.
You can find more examples of co-occurence networks in our Introduction to Network Analysis and Cytoscape for XML Coders. That is the kind of network you will be plotting from XML in this exercise.
XML structures make very good sources for network analysis because they usually show some basis for shared association based on the document structure: What shows up frequently together in the same marked structure? Study your project markup and consider what networks of information might be present in your markup. Try writing it out like the TSV lines in this assignment. What is your source node, what is your target node, and what is their shared connection?
You may work with any of our student project files loaded into our eXist database to plot a network of co-occurrence of any kind that interests you, but for best results we advise you to keep it simple with just one kind of node (say, individual names, place names, reading witnesses, etc.) and some unit of co-occurence drawn from the structure of your XML files.
Study the XML code from a sample project file (ideally in <oXygen/>) to identify a co-occurrence relationship that interests you. Your network does not have to be about people and places, but could be based on something else you have marked, such as rhyme patterns or an interesting phenomenon you have been marking.
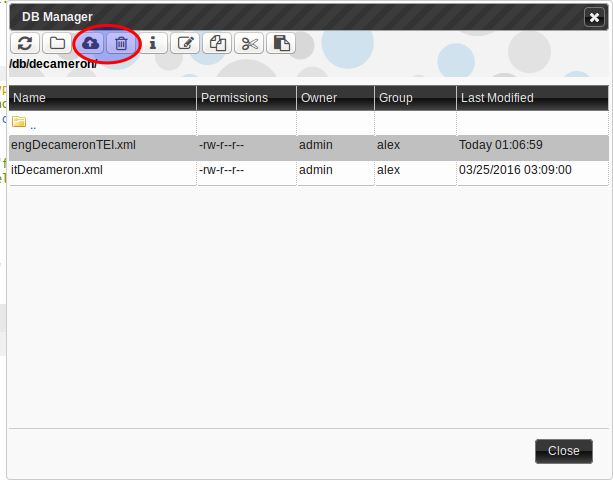
Note: You may wish to update your project files in our eXist database (and as you review and plot your output data you will almost certainly see evidence of tagging errors like extra spaces in elements that might yield two separate nodes with the same name, etc.). To update the file, go to File → Manage, browse for your project directory and locate the file you want to change, and delete it from the database by selecting it and clicking on the trashcan symbol. Upload your new file by clicking on the upload button to the left of the trashcan.)
Our network software will import either TSV or CSV text files. We typically prepare a TSV rather than a CSV because sometimes our node data contains commas and simple white spaces, but it never contains a tab character, so we know we can safely use it as a separator character. Since our output will be strings of text, we will need to use the concat() function to concatenate (or combine together) each single piece we need for each line, including the tab characters, 	. Read about concat() and its cousin string-join() in the Michael Kay book on p. 545 or search for concat
on the w3schools XSLT, XPath, and XQuery Functions page . We will actually want to use these two functions together when we return our text output, because we will want to produce the following format for our TSV.
Source-Node [tab] Edge-Interaction [tab] Target-Node [return]This effectively expresses something like a simple sentence:
Thing-1 [tab] is-in-a-special-shared-place-with [tab] Thing-2 [return]
We can also express just the Source Node and a Target Node with the idea that the edge is implied in each line of the TSV.
We are almost certainly going to need to clean up
and de-dupe
(or remove duplicates from) the input data! Almost every project will feature some level of mess to clean up, and one very simple clean-up you can apply here is to remove any extra white spaces in your input nodes, while doing the XQuery! For this we use the XPath function normalize-space(), which simply removes leading and following white spaces, and makes sure that <city> Erie</city> turns out to be the same single distinct value as <city>Erie </city> and <city>Erie</city>. To use normalize-space(), we typically walk the tree to the nodes we want to process, and place normalize-space(.) like so at the end of the XPath:
let $input1 := $yourVariableStartingPoint//walk//the//tree//to//here/normalize-space(.)
In our return, we are going to use concat() to hold the Source-Node, [tab], Edge-Interaction, [tab], Target-Node, and then we will bundle that concat function inside a string-join() with the special unicode character of a line-feed or hard-return, , as the separator of each line in the output text. To help style the network, we recommend outputting a label for each kind of data you are networking together, as in this example:
episode Bending Battle character Sokka
Here, we are outputting a label episode
, a tab space, the episode title, another tab space, a label character
, another tab, and the character name Sokka. Generating the TSV file that holds a collection of information like this effectively stores all the network data, and when we import it in Cytoscape we can run the software to calculate, plot, and study its network statistics: which nodes are the most connected to other nodes? Which nodes are necessary to hold the network together? Which parts of the network are only connected to one episode and not any of the others? We can output and style our network plot in many different ways to help explore these questions, and that will be our focus in the next stage of this assignment, but for now, we need to generate the network data to identify the nodes and edges in the first place.
This is an exercise in nesting a pair of for loops
For Loop to generate this (together with any information you want to share about that node, called a node attribute), and hold its edge information too: anything you need that is in a one-to-one relationship with the Source Node. But in order to retrieve the Target-Nodes, you need to realize that for each single Source Node, there may several other nodes that co-occur with it in the same space. That means that you need to define a variable that will catch the whole series of target nodes, and then walk through them one at a time, so that you produce each separate line of text to match on each Target node. That means that each Source Node will need to be output several times, each time for every Target. Return everything in a concat() using the tab characters we described above, and bundle that in a string-join() with the line-feed return character, also described above.
distinct-values() for Node DataThink about whether you want to network every single time your node appears with every other node in your document. You would produce many duplicate lines of data and your resulting graph would contain many edge lines: Bergamino may appear in the same place with Lauretta over and over and over again. Is that data relevant to your network? You could simplify by taking distinct-values(), and then you would only be noting whether or not two characters appear together at all in a given location, not how many times they appear together. Then again, you might actually want to know that information! To make this really efficient, you can reduce the size of your output by taking distinct-values, and you could also create a separate variable that just goes and checks the count() of the number of times the target node appears in the same context with the source node. If you simply collect that as a number, you could use that number as an edge attribute in Cytoscape when you graph your edge lines: Perhaps you could plot the thickness of an edge line based on how many times the target node shows up in the presence of the source node. Varying the thickness of the edge-lines in a network graph is known as weighting the edges
.
if (...) then ... else ...Depending on what you are plotting in your network, you may want to distinguish among different kinds of nodes or different kinds of edge locations. In the following example from The Decameron we output three different words to indicate whether an interaction occurred in floatingText, in the outer frame around the stories, or inside the stories themselves. We also needed to determine the peers of each distinct character who are mentioned in the same layer of text, and that meant looking only inside the appropriate ancestor::div[1] or ancestor::floatingText element that contains the characters in question, all the persName elements that are not equal to the Source Node. To output different kinds of information based on the distinct locations of these elements will require a conditional series of if () then () and else statements to determine the output of a variable. Here is how to work with iffy conditionals. These sit inside a variable definition to control how it may be defined based on the conditions you set:
let $variable:=
                     if (XPath condition 1)
                              then some-value-to-store--either XPath or "text"
                     else if (XPath condition 2)
                               then some-alternative-value-to-store--either XPath or "text"
                     else some-other-value-for-all-other-cases--either XPath or "text"
So, in something more like the variables we prepared for network analysis:
let $edge:=
               if ($treeWalker[. = $distinctValue]/ancestor::whatEver)
                              then "whatEver"
         else if ($treeWalker[. = $distinctValue]/ancestor::somethingElse)
                              then "somethingElse"
         else "remainingOption"
In this example, we involved a $treeWalker variable that we set earlier in the XQuery to walk the trees
of the XML file(s) before we took distinct-values(). In order to check for the peers and to look up the edge data for our network, we need to check each name element in the XML to see if it corresponds to the current entry in our list of distinct-values, and when it does, check to see which conditions it meets. It should output a different condition depending on its placement, and if we do this right, we will identify every condition that matters to us. The final else statement could be left empty, or could be given a value to output to account for any other case that we didn't define in the preceding conditionals. We can have as many else if statements as we like and make a long running list of conditionals, but for the purpose of our network we decided to keep this simple: The words we output in this variable will signal three different states that ultimately we will be able to color-code or plot distinctly in our network graph,
When you are retrieving good output, you need to pack this up into a TSV file that we can import into Cytoscape. This is a little tricky with outputting a plain text file, because every line of returned text seems like a separate thing to XQuery, and eXist will throw an error when you try to save your output as a single file. To bind all the lines together so it can be read as one united piece of text, you need to position a string join() around the whole FLOWR and return, so that the concat() function in the return is actually the first argument in the string-join(), which then has the second argument be a line-feed (or hard-return) character. And one more thing! To make sure that the output is understood to be plain text and not the default XML format that eXist expects to be producing, just a "text/plain" assertion to the end of the xmldb:store() function. Here's a sort of abstract view of how that should look, with a little summary of what we have discussed so far. We decided to output lines of text containing four values: a source node, an edge, an edge attribute, and a target node. Here is the code from our advanced example using if-then-else statements. (Simpler code examples are saved in the newtfire eXist-dB in 2022Class-Examples.)
xquery version "3.0"; declare default element namespace "http://www.tei-c.org/ns/1.0";declare variable $ThisFileContent:= string-join(let $engdecameron := doc('/db/decameron/engDecameronTEI.xml')/* let $engpeople := [stuff] let $engdistinctPs := [stuff] for $edp in $engdistinctPs let $edgeType:= if (condition 1--the floating frames) then "floatingFrame" else if (condition 2--the novellas) then "novella" else "frame" let $edgeWeight:= if (condition 1--the floating frames) thencount(XPath-to-list-of-peers-in-floatingText)else if (condition 2--the novellas) thencount(XPath-to-list-of-peers-in-novellas)elsecount(XPath-to-all-the-other-peers-not-covered-in-the-other-conditions)let $peers:= if (condition 1--the floating frames) thendistinct-values(XPath-to-list-of-peers-in-floatingText)else if (condition 2--the novellas) thendistinct-values(XPath-to-list-of-peers-in-novellas)elsedistinct-values(XPath-to-all-the-other-peers-not-covered-in-the-other-conditions)for $peer in $peers return concat($edp(:source node:), "	"(:tab character:), $edgeType(:shared interaction or edge:), "	", $edgeWeight, "	", $peer(:target node:)), " ") ;let $filename := "MyNetworkData.tsv" let $doc-db-uri := xmldb:store("/db/myOutput", $filename, $ThisFileContent,"text/plain") return $doc-db-uri (: output at http://exist.newtfire.org/exist/rest/db/myOutput/MyNetworkData.tsv ) :)
View your data in the browser and you should be able to download it from there and save it locally (when prompted, save as all files
instead of plain text
, so your computer preserves the .tsv at the end and doesn’t add .txt to the file extension.) Or navigate your way to it in your output directory in eXist, and use the File menu there to download it.
To make sure that your data is good and readable, we conclude this assignment by having you import your TSV file into Cytoscape. Follow the instructions for import in the Cytoscape Tutorial. If Cytoscape gives you a preliminary plot and a network table, you have successfully prepared a good TSV file to work with! If not, you may need to repair something in your XQuery. In the next assignment, we will work on processing your data in Cytoscape to calculate its network statistics and prepare meaningful and legible network visualizations.
Upload your XQuery script (in a text file), and your output TSV file to the Canvas upload point for this assignment.